Spotivity case study
Overview
Spotivity is a digital platform connecting youth and their parents to after-school programs and activities.
The company provides a double sided digital platform that serves Chicagoland area youth and their parents by giving them access to after-school programs. Our team was tasked to improve the administrative facing dashboard which helps after-school programs to maximize their reach and retention of participants.
The outcome was a redesign of an internal facing platform with research that has been tested and validated by target users.
Client
![]()
Role
UX Designer
Faciliator
Product Designer
Team
5 Designers
Timeline
4 weeks, 4 sprints

Understanding the challenge
THE KICK OFF
Our client came to my team to help them explore ways to set them apart from all of the other management platforms by focusing on building a more robust and adaptable tool and adding value to each after-school agencies. The Spotivity platform already had built a beta version of an internal facing dashboard with features implemented from assumed user needs. The challenge was to unveil the pain points of what after school program agencies were facing when trying to accomplish their daily tasks of managing their programs and their students.
Understanding client goals
During the first kick off with our client, we made sure to understand their business and product goals by identifying their intended audience, existing constraints and how they would define success.
The primary value for premium agencies is a website that helps them generate and measure a material increase in participation, engagement and general exposure to their program
Diving into research
RESEARCH OBJECTIVES
With the client’s goal in mind, we set 3 research objectives:
01.
How do agencies currently gather and maintain data for their work
02.
What are the frustrations and obstacles to increase youth participation and engagement?
03.
What types of information will be useful for agencies to better engage program participation?
UNDERSTANDING THE COMPETITOR

Direct Competitors
We looked into top competitors with target audience of small businesses, administrative staff, schools, sports leagues and clubs as well as non-profit organizations within the Chicagoland area. Underlining themes included education and after-school/productive stimulation for youth.


Indirect Competitors
To gain a different perspective, we also looked at indirect competitors like Yelp, Instagram, Opentable, Linkedin, Salesforce, Mindbody and Donortools, to see if there were any opportunities we could leverage.
They provided a lot of insights on how to effectively engage and motivate users through features and functionality that are working well and which users are familiar with.
We discovered that the management tools out on the market were already being implemented and a few of these competitors did it very well. Yet, there were still some opportunities and gaps we can leverage moving forward.
UNDERSTANDING OUR USERS
Who we spoke to

DISCOVERING INSIGHTS

SYNTHESIZING WHAT WE HEARD


After synthesizing the insights, the team grouped users between nonprofit and for-profit agencies/programs. We found nonprofit organizations prioritized money as an important element in their business where for-profit or established organizations prioritized outreach to participants. The common denominator between the two groups included time, which is a driving factor for both goals.
We also found one of the biggest trend of challenge that emerged: lack of centralized platform where they can access reports, engagement and recruitment.
With this opportunity, our team decided to place emphasis on building a consolidated view of the metrics to track the most essential information to help save time.
Outlining the problem
THE PROBLEM STATEMENT
From our insights we found overlapping themes regarding the importance of outreach, retention, and recruitment. The more time agencies have to foster meaningful relationships with the students, the better chances of a program succeeding. With this in mind, we defined the problem to solve for:

Now that we had a clearer view of the problem after-school agencies faced, we created three design guidelines to help influence our design decisions to make a product that was efficient, engaging and easy to use.

Empathize and Define
IDEATION
Our concepts

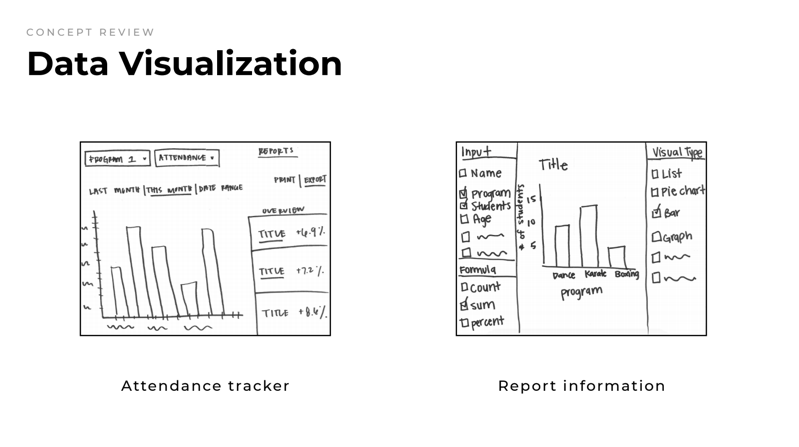
After narrowing down to 12 low-fidelity paper prototypes, we tested for the following 5 themes to address our findings from user insights:
Customization
Data Visualization
Communication
Student information
Business tasks


PUTTING OUR CONCEPTS TO TEST
We tested for desirability and usefulness of each concept and explored how users might integrate these into their current organization task management habits. We tested 5 users with experience working in nonprofit/for-profit organizations. This helped us to define opportunities and recommendations.


Even though we felt the need for all 5 themes we concepted for, we knew we had to part ways with the ones that didn’t test well with our users. We decided to take all the positive points of feedback and focus in on the drill down of the dashboard metrics and to hone in on student profile feature for Spotivity’s redesigned platform. As for the customization concept, we decided to forego the drag and drop function as it would require unnecessary extra hours of their developers. We came up with a simpler solution to customization which was more feasible.
We envisioned the new Spotivity to be a platform that encourages users to be efficient in their administrative tasks so that they could spend more time helping their agency and its students reach their goals.
We met with our client to align with our next step of creating an MVP.

Explore and learn
The drill down
We began by mapping out a student’s interaction with the front end of Spotivity to gain insight into what agency would see on their dashboard

Following this double-sided journey helped us to move forward with prototyping the agency side of the dashboard.
We incorporated the following features:
Customization
Report creation
Data Visualization
Attendance & program tracker
Report information
Student information
Student progress snapshot
Results
For our last client meeting, we delivered a mid-fidelity prototype to our client after iterating based on the usability tests we conducted along with a future product roadmap. Our team also redesigned Spotivity’s landing page and created a tablet and mobile view of the dashboard.
The product
DASHBOARD HOMEPAGE
Validated key Features: Data Visualization of attendance and tracker
Aggregate view of: Overview, Visits, Attendance, Retention
Detailed view of: Total students, Total views, Total favorites, Total check-ins
METRICS DETAILED VIEW

Validated key features: Data Visualization of report information
Detailed view of: Traffic of the demographic, profile views and unique visitors, visualized view of total views by months, student check in, and import/export options
STUDENT PROFILE

Validated key features: Student progress snapshot
Featuring visualized data: Attendance, demographics
With detailed information on: Progress, parental information, basic information, note section
Something extra

Our team delivered a new landing page as well as a tablet and mobile view for our client
The impact
Client feedback
Our new design and interactive prototype was well received by our client who was enthusiastic about implementing our dashboard design into Spotivity’s internal facing platform. The client entrusted us to move forward as advisors and our next steps are to be in communication with the developer team to take our product to implementation.
UPDATE (September 30, 2019)
We recently received an email from our client:
“I wanted to reach out to let you know that almost all of your input into Spotivity has been realized. I first focused on the app and that launched in the new iteration earlier in the spring. Additionally, the re-vamp of the admin dashboard and marketing website is about to launch.”
Future Recommendations
Due to the time constraint of our sprints, we couldn’t address every gaps and opportunities we wanted to. Through insights from usability testing, we gathered the following future recommendations:
Implement metadata for IA
Capture more metrics for student information
Create various calendar view for coaches, athletes, faculties, parents and students
Implement on/off autofill
What I learned
Working in a fast-paced, collaborative environment for a client was a thrilling experience. I was able to quickly adapt and learn how to leverage each teammate’s strengths to work efficiently and to deliver meaningful solutions to research-validated problems. This project has given me an invaluable lesson to trust the process and to value research to make impactful user-driven design decisions. I have also learned how to recognize constraints and to work within those limitations.
My key learnings include:
